What is Volatility Smile?
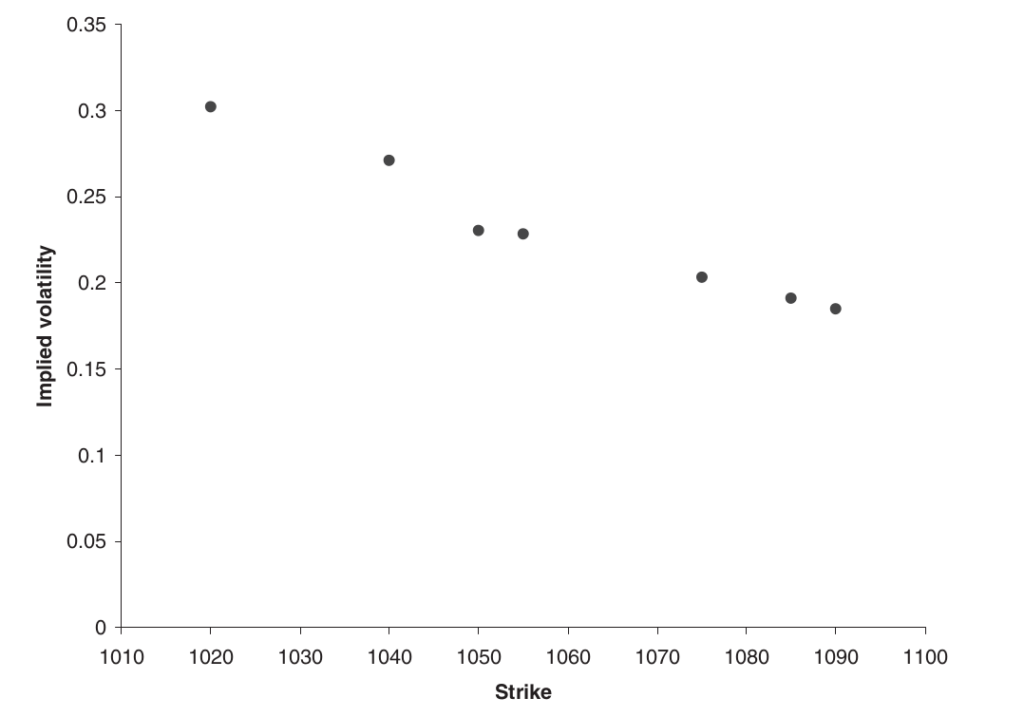
The expression “volatility smile” refers to the variation in implied volatilities of options based on their strikes. A smile indicates that out-of-the-money puts and calls have larger implied volatilities compared to at-the-money options. Other shapes are possible.
Skew is the term used to describe a slope on a curve. A negative skew indicates a downward sloping graph of implied volatility vs strike.
A Short Example

A Deep Dive into Volatility Smile
Let’s start with how to determine implied volatilities. To use the Black-Scholes method, start with vanilla option pricing, often the midpoint between bid and offer, as well as additional characteristics like strikes, expirations, interest rates, and dividends (excluding volatility). What volatility should be employed for each option series to ensure that the theoretical Black-Scholes price matches the market price?
The Black-Scholes formula for option values is based on volatility. However, there is no formula for implied volatility, which must be determined using a numerical technique such as bisection or Newton-Raphson to discover zeros. Plot implied volatilities against strike, with one curve per expiration. This is the implied volatility smile. Plotting implied volatility versus strike and expiration in three dimensions creates the implied volatility surface. Long-dated options often have a flat smile, while short-dated options tend to be steeper.
The Black-Scholes formulas, which assume constant or time-dependent volatility, may result in a flat implied volatility map. Real option-price data suggests otherwise. How do we explain this? Here are some questions to ask.
- Is volatility constant?
- Are the Black–Scholes formula correct?
- Do option traders use the Black–Scholes formula?
Volatility doesn’t appear to be consistent. Actual volatility refers to the randomness of a stock’s return, rather than being constant.
Volatility can be measured using a stock price time series and would still exist without options. While it’s clear that volatility is not continuous, predicting its future behaviour is challenging. This could explain why implied volatility is not constant, despite popular belief that it is.
Focus on Black-Scholes limitations
If volatility is not constant, Black-Scholes formulas are incorrect. The Black-Scholes formula is applicable when volatility is a deterministic function of time. However, I believe we can confidently discount this idea.
Despite this, option traders continue to utilise the Black-Scholes model for vanilla options. The Black-Scholes model remains the most widely used for vanilla contracts.
It is simple to use, has few parameters, and is highly durable. Its downsides are well acknowledged. Many people “adapt” Black-Scholes models to address shortcomings, rather than utilising models without them.
A stock’s volatility may increase temporarily after a significant drop.
How can that fit into the Black-Scholes framework? Simply increase the implied volatility for options with lower strikes. A low strike put option is out of the money until the stock falls, when it may become profitable. However, volatility may increase. Increase the volatility of all out-of-the-money puts. The difference from the flat-volatility Black-Scholes environment becomes more noticeable near expiration.
The volatility smile reflects kurtosis in stock returns. Stock returns are not normal, and stock prices are not lognormal. Both have larger tails than expected for properly distributed returns. The theoretical value of an option is equal to the present value of the expected payoff in a risk-neutral random walk.
If the risk-neutral probability density function has fat tails, option prices should be higher than Black-Scholes for both low and high strikes. Hence, larger inferred volatilities and the grin.
Arbitrage and the Volatility Smile: Managing Risk in Option Portfolios
Some argue that volatility skew and smile are caused by supply and demand dynamics. Option prices are determined by a buyer and seller’s agreement, rather than the probability of tail events. Out-of-the-money puts offer cost-effective insurance against a crash. Insurance is typically costly due to profit motives on the part of the seller. Out-of-the-money puts are relatively overpriced. This explains the elevated implied volatility for low strikes. Some stock owners use out-of-the-money call options, also known as covered call writing, to get a premium during sluggish markets.
Oversupply of out-of-the-money calls will lead to lower prices. The net consequence is a negative skew. Traders prefer the supply/demand argument, while quants disagree as it implies incorrect pricing and potential arbitrage opportunities.
When analysing simple option portfolios for arbitrage, it’s important to consider limits on skew and smile. A call option’s price decreases as the strike increases, as expected. Alternatively, purchasing the low strike call and selling the higher strike call can be a profitable strategy. This constrains the skew. Similarly, a butterfly spread must have a positive value because the reward cannot be negative.
This places a limit on the curvature of the smile.
Both of these requirements are model-independent. There are multiple approaches to include the volatility-smile effect into an option-pricing model without resulting in arbitrage. The most popular are, in order of complexity, as follows
- Deterministic volatility surface
- Stochastic volatility
- Jump diffusion
The deterministic volatility surface proposes that volatility is a known function of stock price and time, denoted as ![]()
![]()
Focus on stochastic models and smile
Stochastic volatility models have two sources of randomness: stock returns and volatility. The correlation between two random sources is a parameter in these models. When stock prices decline, volatility often rises due to a negative correlation. This creates a negative skew for implied volatility. Unfortunately, the negative skew is frequently not as noticeable as the true market skew. These models can also explain smiles.
Convexity, in general, costs money. In the simple Black-Scholes model, we pay for gamma.
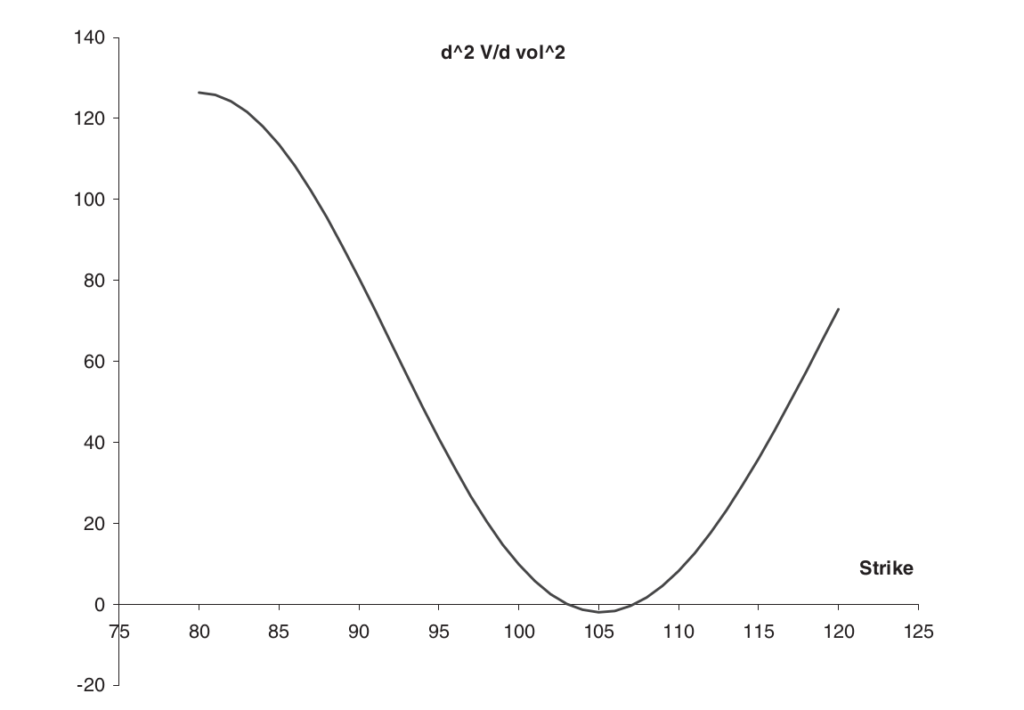
In the stochastic volatility world, we may look at the second derivative of option value with regard to volatility. If it is positive, we anticipate to pay for this convexity, which means option values will be higher where this quantity is highest. In today’s volatile market, there are options for calls and puts.

The function is plotted below with S = 100, T−t = 1, σ = 0.2, r = 0.05, and D = 0. Observe a positive attitude away from money and a negative attitude towards it.

While stochastic volatility models have the ability to capture dynamics, selecting the right model and determining its parameters remain challenges. Even when calibrated to market pricing, your model’s “constant” parameters may change. Calibrated models may still not be accurate, despite their intricacy and potential.
Jump-diffusion models allow for discontinuities in stock and volatility. Models with a large number of parameters can provide instantaneous accuracy, but may not be stable over time.
Related Readings
- Modern Portfolio Theory in Finance
- Arbitrage in Quantitative Finance: All You Need To Know
- Modelling Approaches in Quantitative Finance: All You Need To Know
- Put-Call Parity: All You Need To Know